Visualizing KPIs
KPIs in ESDL can be attached to different objects:
the top level area
sub areas
assets
Top level area KPIs
KPIs attached to the top level area are visualized using a dialog with graphs.
Sub area KPIs
KPIs attached to areas that are sub areas of the top level area are visualized as follows:
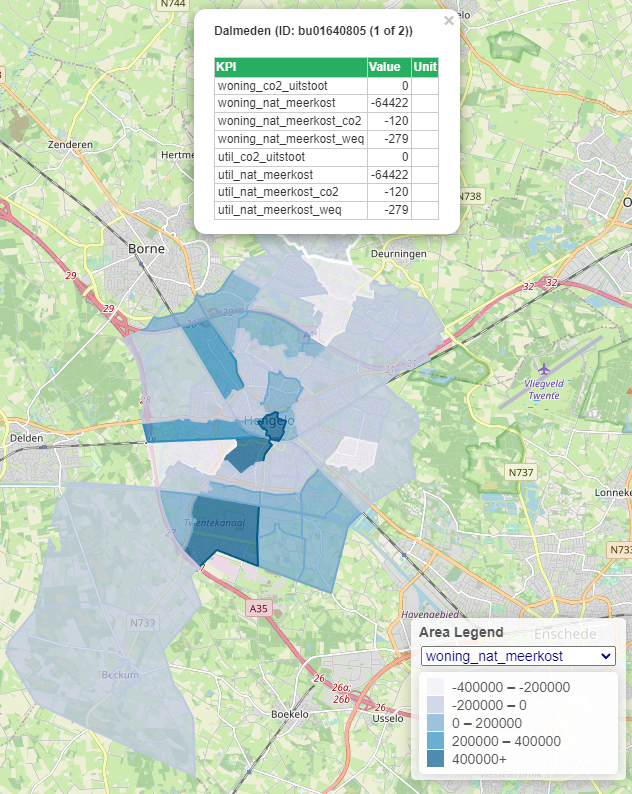
In the legend at the bottom right you can choose the KPI that is used for coloring the areas
If you hover over the areas, all KPIs attached to that area are shown as a table in the tooltip
Asset KPIs
Asset KPIs are currently not visualized