Adding assets, areas and potentials
Energy assets are the core components of an ESDL energy system description. Energy assets can be subdivided into 5 different types, the so called ESDL capabilities.
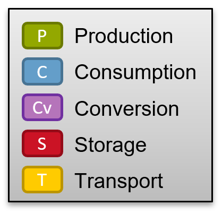
The following table shows some examples of each capability with its MapEditor icon:
ESDL asset types |
Example icons |
ESDL asset examples |
Producer |
|
WindTurbine, GeothermalSource, Import |
Consumer |
|
HeatingDemand, Export, ElectricityDemand |
Conversion |
|
PowerPlant, HeatPump, GasHeater |
Storage |
|
Battery, ATES, WaterBuffer |
Transport |
|
ElectricityCable, Transformer, Pipe |


Areas and potentials can only be added using the asset draw select tool, but there are multiple ways to add assets to the map:
Via the asset draw select tool (nr 3. in this picture)
Via the asset draw toolbar (nr. 15 in this picture)
Using templated assets from the Energy Data Repository
Adding assets, areas or potentials via the asset draw select tool
Adding assets, areas or potentials is done via the asset draw select tool located in the middle of the top menu bar. Actually it is split into two separate select tools to speed up drawing pipes and cables.
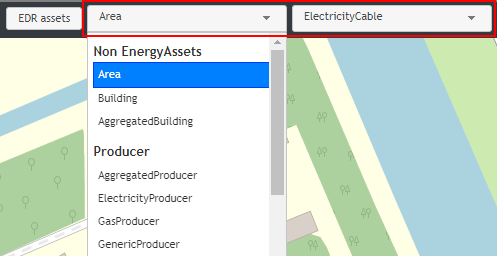
The left select tool (nr. 3 in this picture) contains 7 groups:
a group for ‘Non EnergyAssets’, with Area, Building and AggregatedBuilding
5 groups for Producer, Consumer, Storage, Transport and Conversion assets
a group with all ‘Potentials’
By selecting one of the options out of this list, the user starts drawing this on the map immediately.
Another relevant UI part are the draw controls (nr. 12 in this picture):

From top to bottom they represent drawing a line, drawing a polygon, drawing a square and drawing a point (or marker).
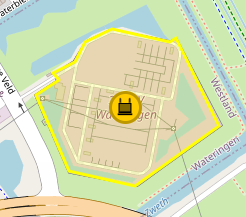
Each asset (and area and potentials too) has a default ‘shape’ on the map. At the moment these defaults are:
Polygon: Area, PVPark, WindPark
Line: Pipe, ElectricityCable
Point: everything else
You can switch the shape using the draw controls on the left, before clicking on the map. So for example, if you select a Transformer asset from the list, by default the ‘marker draw tool’ is selected. If you first click on the ‘polygon draw tool’ and then start drawing on the map, a Transformer asset can get a polygon geometry where the space taken on the map by this transformer is represented in the ESDL data.
Drawing pipes and cables
Pipes and cables can be drawn using the method above (by selecting Pipe of ElectricityCable in the long list of the left select tool). To speed up drawing pipes and cables, we’ve added a second select tool specifically for pipes and cables. If the user selects the ‘line draw tool’ from the draw controls on the left, the right part of the select tool (nr. 4 in this picture) determines if a pipe or a cable is drawn.
Note
ElectricityCables and Pipes can also be added as icons (with a point location) instead of lines. This can be useful if your model requires to add properties of a cable or pipe (like capacity or diameter), but you don’t know the exact trajectory of the cable or pipe.
Adding assets via the asset draw toolbar
Adding assets using the Asset draw toolbar is the most convenient way of doing this. It is fully user configurable and adding assets is just a matter of clicking once on the icon of the asset on the toolbar and then clicking on the map (once or as many times as you like). The default shape can again be changed before the actual drawing is started.
In this section the configuration options of the asset draw toolbar are described in more detail.
Adding assets using the Energy Data Repository
Adding templated assets from the Energy Data Repository (EDR), can be done by clicking on the ‘EDR assets’ button at the top (nr. 2 in this picture). It’s described in more detail here